Every Airbnb Bali investment pitch sounds the same: “15% returns, 80% occupancy, passive income while you sleep.” Then you buy the villa, list it on Airbnb, and reality hits. Your occupancy hovers at 55%, half your revenue disappears into expenses you never budgeted for, and that “passive income” requires 20 hours a week managing guests across 12 time zones.
Here’s what nobody tells you: the average villa Bali on Airbnb generates $20,774 annually with 65% occupancy, but after management fees, staff costs, utilities, platform commissions, and taxes, net profit typically falls to $8,000-$12,000. That’s 40-60% of your gross revenue consumed by operating expenses before you see a single dollar.
We manage 40+ villas across Canggu, Uluwatu, Seminyak, and Pererenan. We see the real numbers every month, not the fantasy figures in investment brochures. This breakdown shows you exactly what Airbnb hosts actually earn, what they actually spend, and what separates the 70%+ occupancy winners from the 45% occupancy disasters.
The Real Occupancy Numbers: What 37,567 Listings Actually Achieve
As of October 2025, there are 37,567 active Airbnb listings in Bali. That’s not a typo. The market has exploded from around 20,000 listings in 2022 to nearly double that figure today. And every single one of those properties is competing for the same pool of guests.
The island-wide average occupancy rate sits at 65-66% annually. That sounds decent until you realize it means your villa sits empty 125 days per year. But averages lie. The distribution looks more like this:
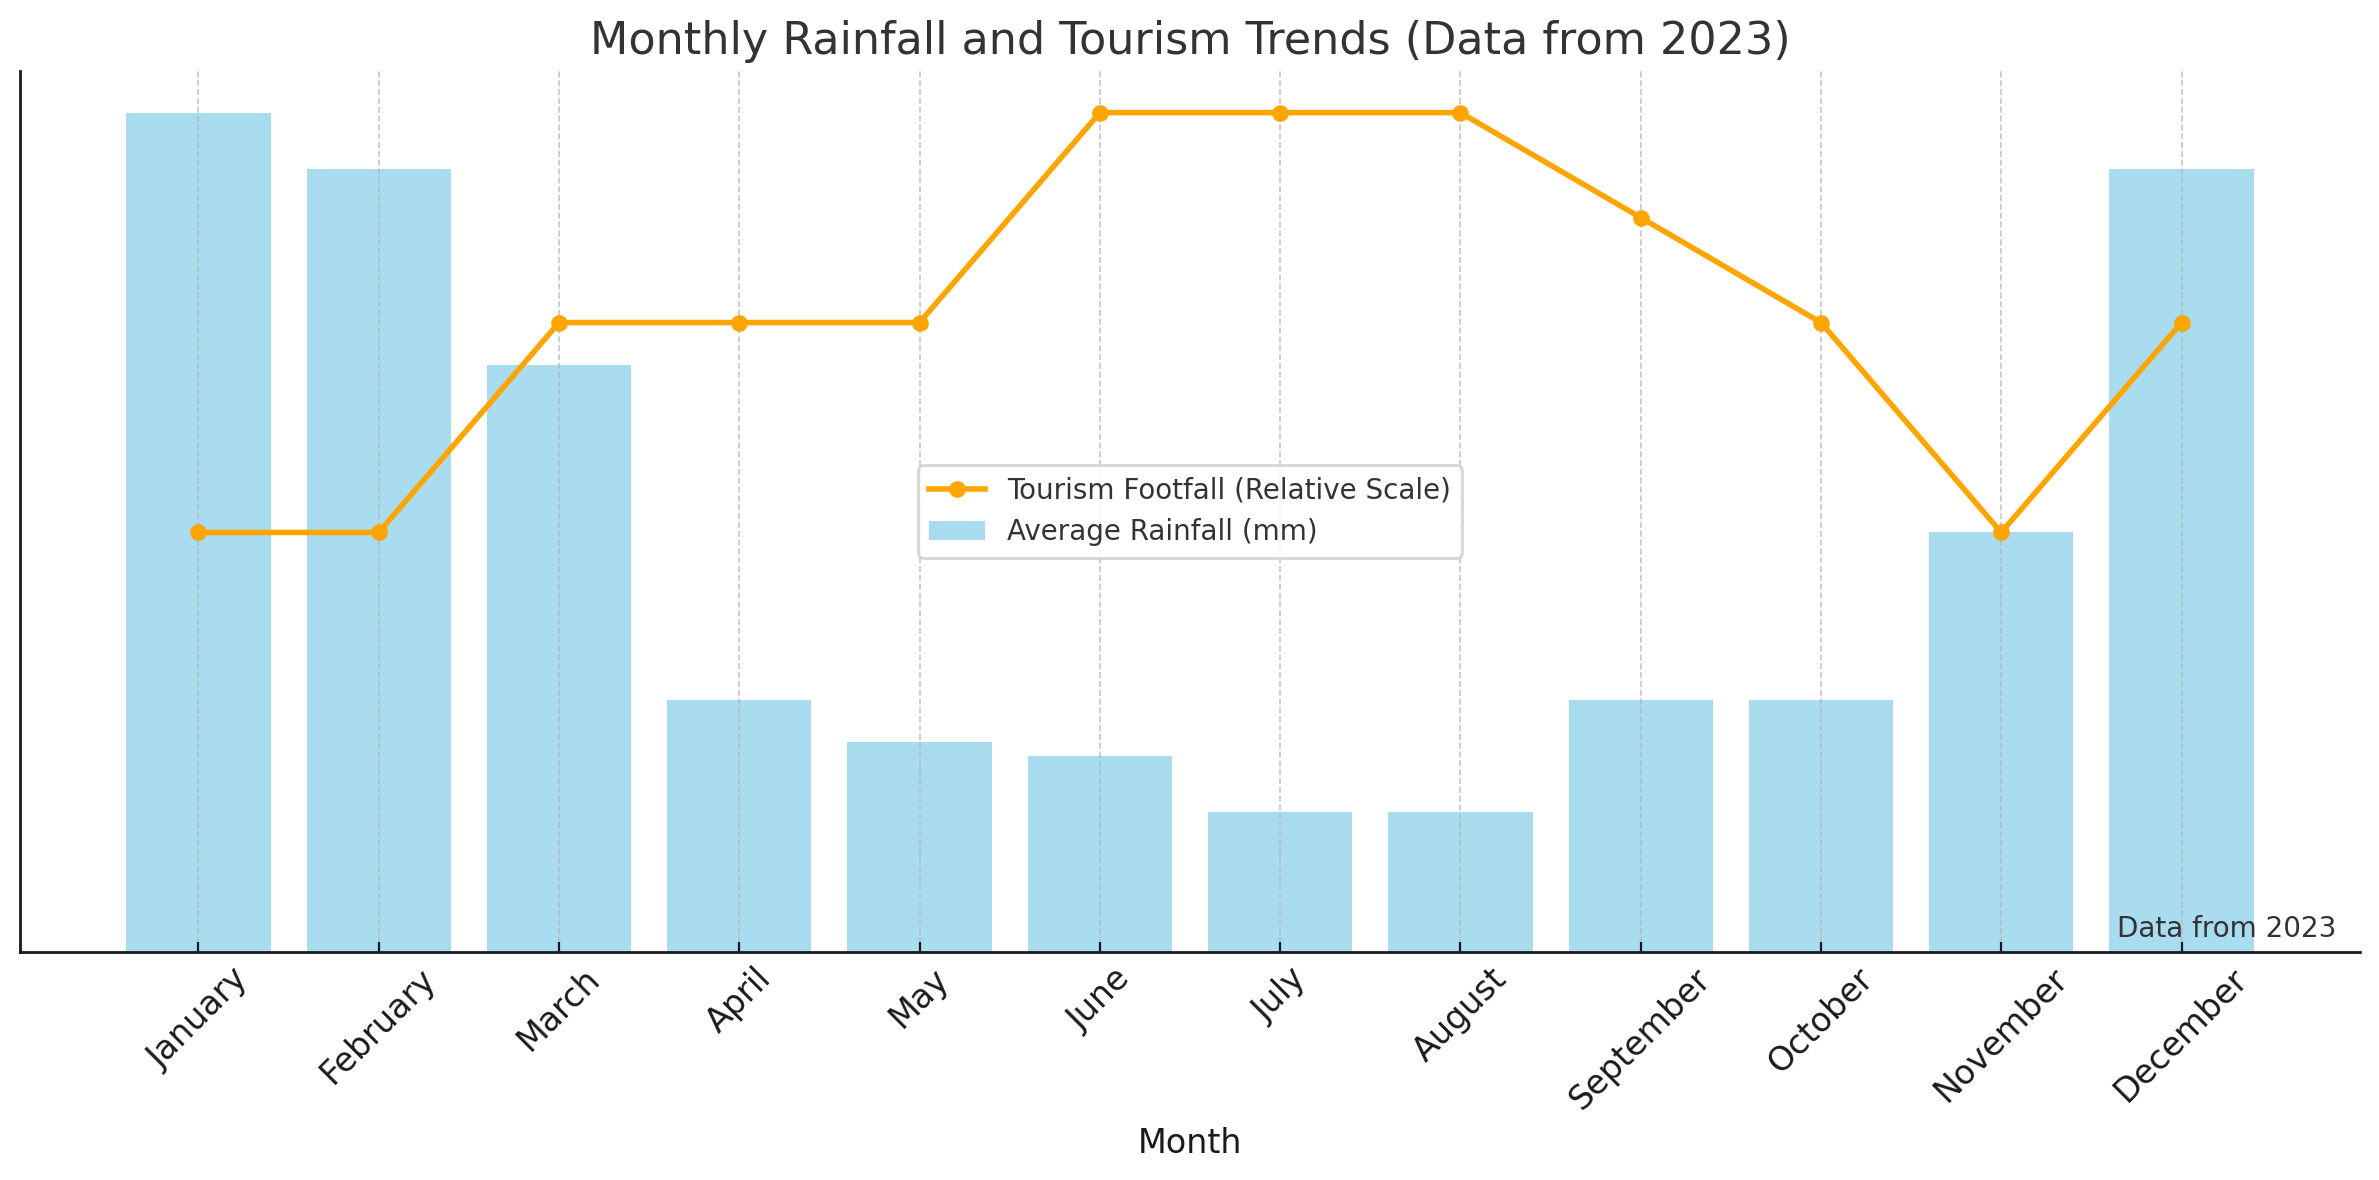
Peak season (July-August) drives the winners. In July-August 2023, top properties hit 89% occupancy. But here’s the catch: achieving peak season bookings requires being booked solid 6-9 months in advance. Properties that wait until June to optimize their July pricing are already too late.
The seasonality swing is brutal. Peak months deliver 80-95% occupancy while low season (November-March) drops to 45-60% even for good properties. Your annual average might be 65%, but monthly reality swings from $6,000 revenue in August to $1,800 in February.
We track occupancy across our 40+ villa portfolio daily. The properties hitting 75%+ occupancy share three traits: professional photography, instant booking enabled, and dynamic pricing that adjusts daily. The villas stuck at 50% occupancy have amateur photos, require owner approval for bookings, and set static prices for entire months.
Location Dramatically Impacts Occupancy
Not all Bali locations perform equally. Here’s the real data from our managed properties and market analysis:
Uluwatu: Average 65-75% occupancy, peaking at 83% for premium properties. The area’s luxury positioning and Instagram-worthy cliffside views attract higher-spending guests willing to book further in advance.
Canggu/Berawa: Average 70-80% occupancy. The digital nomad hub maintains year-round demand with strong shoulder season performance. Competition is intense with 8,000+ listings, but the market can absorb supply.
Seminyak: Average 65-75% occupancy, but performance varies wildly. Premium beachfront properties maintain 75%+, while generic villas struggle at 55-65%. Market saturation is real with 1,739 active listings in Seminyak alone.
Pererenan: Average 70-90% occupancy for newer properties. The “coolest neighborhood” momentum continues driving bookings, though occupancy is highly seasonal here, spiking dramatically July-September.
Ubud: Average 60-70% occupancy. Wellness tourism creates consistent bookings but at lower nightly rates. Properties converting to monthly rentals for yoga retreats see better overall occupancy.
Revenue Reality: What Villas Actually Earn on Airbnb
The average Airbnb Bali listing generates $20,774 annually (IDR 337 million) with a median ADR of $98 per night. But that’s the island-wide average including studio apartments, guesthouses, and luxury estates. For 2-3 bedroom villas, here’s what actually happens:
Revenue by Location: The Geographic Spread
Uluwatu villas lead the pack with average annual revenue of $32,888 at a median ADR of $259 per night. Top performers exceed $50,000 annually, driven by ocean views and luxury positioning. The catch? Occupancy runs lower at 58% average, meaning you need premium pricing to offset vacancy.
Seminyak properties average $22,000-$28,000 annually with median ADR of $180 per night. Established infrastructure and restaurant scene support consistent bookings, but the 1,739 competing listings compress yields. Top 25% of properties command $309+ per night, bottom 25% struggle at $103.
Canggu/Berawa villas generate $24,000-$36,000 annually depending on exact micro-location. Nightly rates run $150-$350 with strong occupancy. Properties near Echo Beach or Batu Bolong outperform those requiring scooter rides to reach amenities.
Pererenan is the wild card, with newer villas achieving $28,000-$42,000 annually during peak performance periods. However, extreme seasonality means 40% of annual revenue concentrates in just 4 months (June-September). Cash flow management becomes critical.
Ubud properties generate $15,000-$25,000 annually with ADRs of $100-$200. Lower rates are offset by longer average stays (4-7 nights vs 2-4 nights in Canggu). Properties targeting monthly yoga retreats at $2,500/month often outperform nightly rentals.
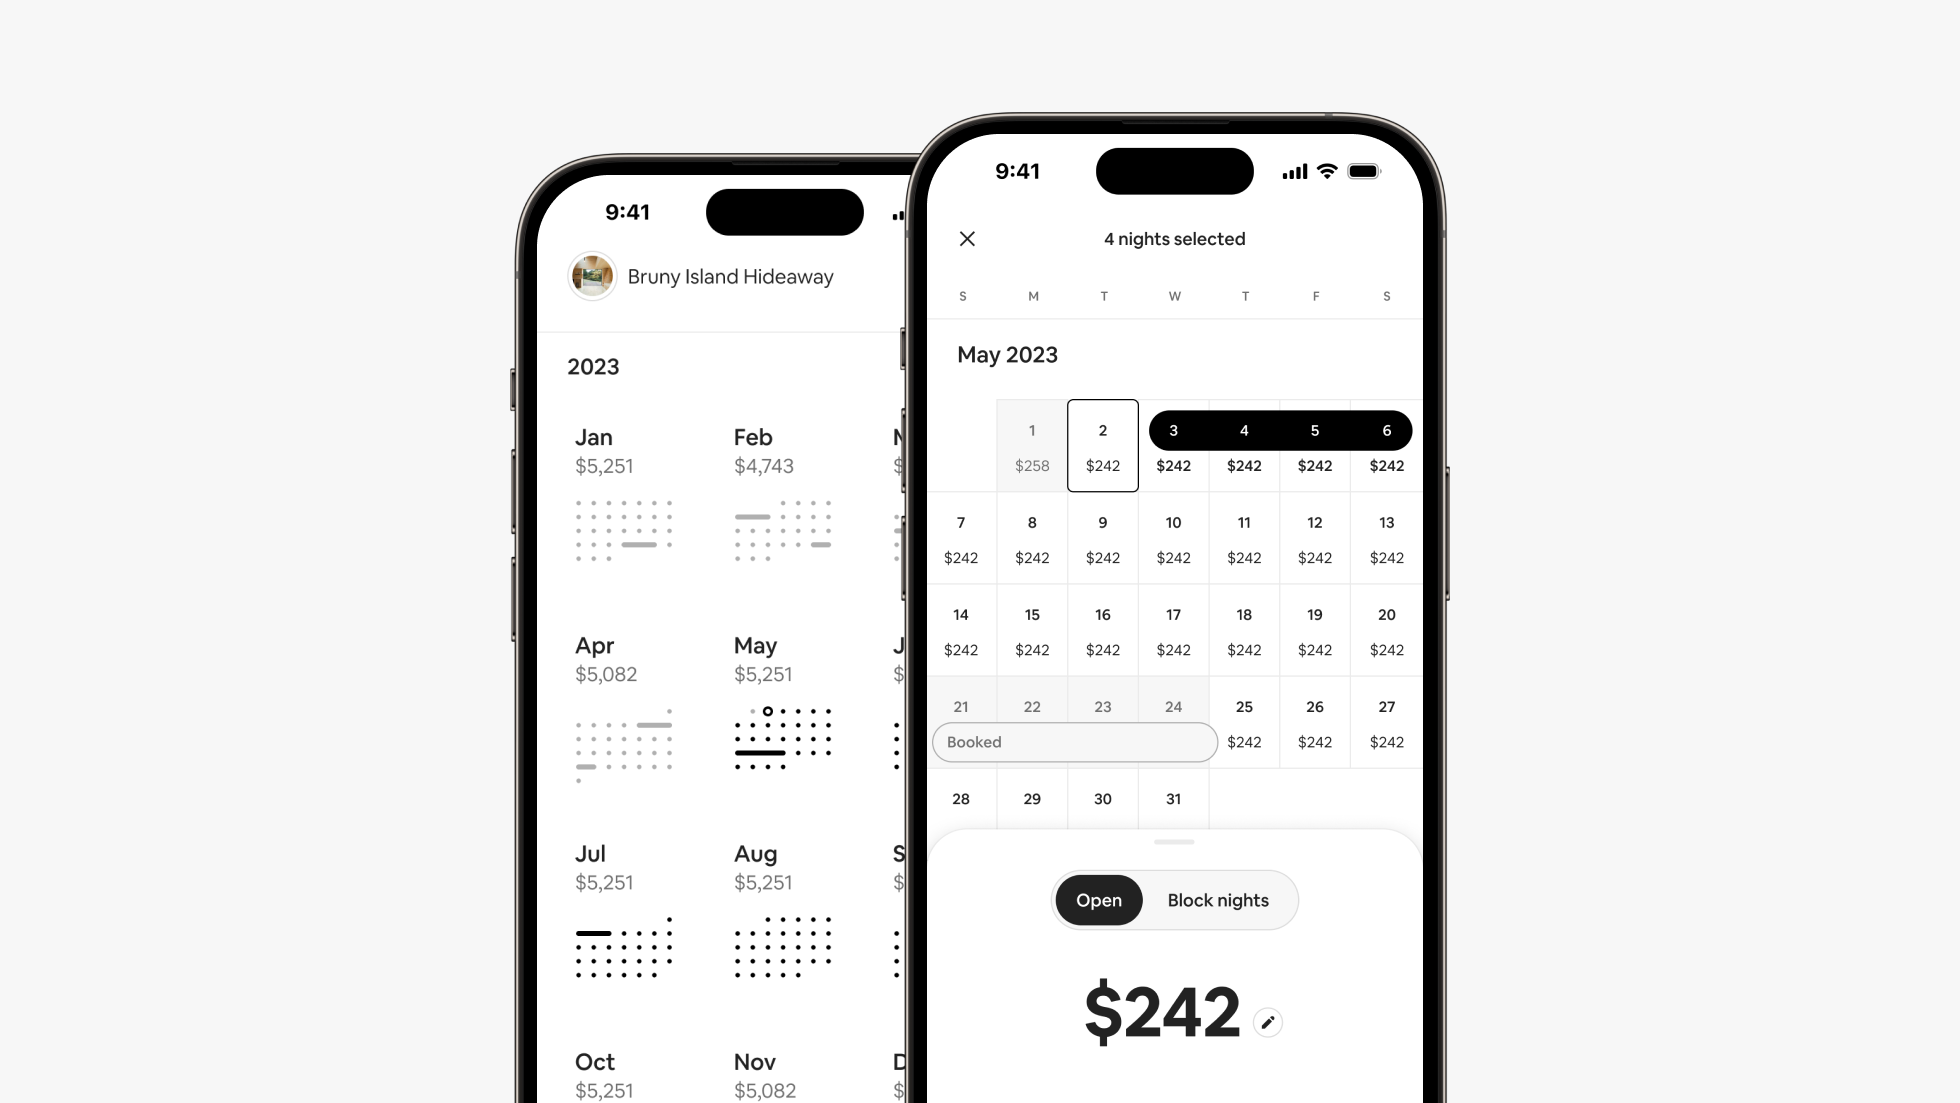
Monthly Revenue Patterns: The Reality of Seasonality
Annual revenue figures mask dramatic monthly swings that destroy cash flow planning for unprepared owners. A villa generating $28,000 annually doesn’t earn $2,333 every month. The pattern looks more like this:
Peak months (July-August, December-January): $4,000-$7,000/month
Shoulder months (April-June, September-November): $2,000-$3,500/month
Low months (February-March): $1,200-$2,200/month
Properties optimized for vacation rental suffer most during low season. Those pivoting to monthly digital nomad rentals at $2,000-$2,800/month maintain cash flow but sacrifice peak season upside.
The villas that fail financially aren’t the ones earning low revenue. They’re the ones that budget expenses based on peak month income, then can’t cover costs when February revenue drops 60%. Smart operators budget on low-season income and treat peak months as profit windfalls.
The Real Cost Structure: Where Your 40-60% Goes
Here’s where the fantasy meets reality. That $28,000 annual revenue sounds great until you realize operating costs consume 40-60% of gross income before you touch a dollar. Let’s break down exactly where the money goes using real numbers from our managed portfolio.
Management Fees: Your Largest Single Expense
Property management services run 15-20% of gross revenue for full-service packages. On $28,000 annual revenue, that’s $4,200-$5,600 going to your management company. Some hosts balk at this and choose self-management or discount 10% operators.
Bad decision.
Our data shows professionally managed properties achieve 15-20% higher occupancy than self-managed equivalents. A villa earning $28,000 at 70% occupancy with 20% management fees ($5,600) nets more than a self-managed property earning $22,400 at 55% occupancy with zero management fees. Plus you’re not working 25 hours weekly managing bookings.
Full-service villa management includes:
- 24/7 guest communication across multiple time zones
- Professional photography and listing optimization
- Dynamic pricing adjusting rates daily based on demand
- Turnover cleaning coordination and quality control
- Maintenance scheduling and vendor management
- Financial reporting and expense tracking
- Guest issue resolution and review management
Premium operators like Bukit Vista charge 20% with no onboarding fees. Others like Bali Management Villas offer tiered options: 18% for full service, 9% for digital marketing only. Budget operators charging 10-12% typically underdeliver on marketing and guest communication.
Platform Commission: The Unavoidable Tax
Airbnb charges 14-16% commission on the host-only fee structure. Booking.com takes 10-25% depending on your program level. If 70% of your bookings come through Airbnb and 30% through Booking.com, you’re paying roughly $4,000-$4,500 annually in platform fees on $28,000 revenue.
Direct bookings eliminate these fees, but building direct booking volume requires significant marketing investment. Most properties don’t achieve meaningful direct booking volume until year 3-4 of operations.
Staff Costs: The Daily Operations
Running a villa rental Bali property requires local staff. Even with management companies coordinating, you’re paying these costs:
On $28,000 annual revenue, staff costs alone consume 18-28% of gross income. This is why properties in ultra-competitive markets struggle. They can’t reduce staff quality without destroying reviews, but margins don’t support premium staffing.
Utilities: The Variable Drain
Utilities fluctuate with occupancy but average $200-$450 monthly for typical 2-3 bedroom villas:
- Electricity: $120-$300/month (varies dramatically with AC usage and guest behavior)
- Water: $8-$30/month
- Internet: $25-$50/month for fiber connection
- Gas: $15-$25/month
High season with full occupancy can spike utilities to $500+/month when guests run AC 24/7. Low season with 40% occupancy drops to $180-$250/month. Annual utility costs run $2,800-$4,500, or 10-16% of revenue.
Maintenance: The Expense Everyone Underestimates
Tropical climate accelerates wear on everything. Salt air corrodes metal, humidity damages wood and fabric, intense sun degrades outdoor furniture and pool linings. Budget $150-$500 monthly for routine maintenance plus reserves for major repairs.
Routine monthly maintenance:
- AC servicing (quarterly minimum): $30-$60/month average
- Pool equipment and chemicals: $40-$80/month
- Appliance repairs: $20-$50/month average
- Furniture and fixture repairs: $30-$70/month
- Pest control: $15-$30/month
Capital reserves for major repairs: Budget 3-5% of property value annually. On a $350,000 villa, that’s $10,500-$17,500 per year, or $875-$1,460 monthly. These cover pool resurfacing ($3,000-$6,000 every 5-7 years), roof repairs ($2,000-$5,000), major appliance replacement, furniture replacement, and structural repairs.
Most new owners skip capital reserves and get hammered when the AC compressor dies ($1,200), pool pump fails ($800), or outdoor furniture needs replacement ($3,000) all in the same month.
Insurance and Property Tax
Villa insurance runs $350-$600 annually depending on coverage level and property value. Property tax in Bali is remarkably low at 0.1-0.3% of assessed value, typically $150-$500 annually for most rental villas.
Taxes: The Profit Killer
Indonesia taxes rental property income. The rate depends entirely on your structure:
Foreign individuals without proper structure: 20% tax on GROSS revenue
Residents with NPWP tax ID: 10% tax on NET income
PT PMA company structure: 10-11% effective rate on profits with expense deductions
On $28,000 gross revenue with $14,000 in expenses:
– Improper structure pays: $5,600 tax (20% of $28,000 gross)
– Proper structure pays: $1,400 tax (10% of $14,000 net profit)
That’s $4,200 annual savings with proper structuring. Over 10 years, improper structure costs you $42,000 in unnecessary taxes.
Complete Profit Breakdown: Real Villa Case Studies
Let’s look at actual performance from three representative villas in our portfolio, showing the complete picture from gross revenue to net profit.
Case Study 1: Canggu 3-Bedroom Villa
Property profile: Modern minimalist villa, 280sqm, private pool, 1.2km from Echo Beach
Occupancy: 74% annually (270 booked nights)
Average nightly rate: $235
On a $380,000 investment (purchase price), this delivers 2.2% annual cash-on-cash return. Not spectacular, but this owner also benefits from potential property appreciation and uses the villa personally 3 weeks annually (value not captured in these numbers).
Case Study 2: Uluwatu Luxury 2-Bedroom Villa
Property profile: Boutique villa, ocean views, 180sqm, infinity pool, premium finishes
Occupancy: 67% annually (245 booked nights)
Average nightly rate: $320
On a $520,000 investment, this delivers 2.4% cash-on-cash return. The premium location commands higher rates but also higher operating costs, resulting in similar net margins as mid-tier properties.
Case Study 3: Pererenan 2-Bedroom New Build
Property profile: Brand new construction, rice field views, 150sqm, modern design
Occupancy: 78% annually (285 booked nights)
Average nightly rate: $195
On a $285,000 total investment (we built this villa from scratch), this delivers 3.2% cash-on-cash return. The new construction advantage shows in lower maintenance costs and higher occupancy (newer listings get preferential algorithm treatment on booking platforms).
The pattern across all three case studies is consistent: operating expenses consume 68-74% of gross revenue. Owners keeping more than 30% of gross revenue as net profit are either self-managing (trading money for 25+ hours weekly of work) or cutting corners that will eventually destroy their reputation.
What Separates 75%+ Occupancy Winners from 50% Failures
After managing 40+ properties, the performance gap between top and bottom performers is massive. Here’s what actually drives occupancy and revenue.
Professional Photography Is Non-Negotiable
Properties with professional photography (drone shots, golden hour lighting, styled interiors) achieve 15-25% higher booking rates than identical villas with amateur iPhone photos. Guests scroll past mediocre photos in 2 seconds. Investment: $300-$800 for full shoot, pays for itself in first month.
Instant Booking Drives 20% More Bookings
Airbnb’s algorithm heavily favors instant booking enabled listings. Properties requiring owner approval lose spontaneous bookers and rank lower in search results. Yes, instant booking increases cancellation risk slightly, but proper screening questions minimize this.
Top performers: 85% enable instant booking
Median performers: 40% enable instant booking
Bottom performers: 15% enable instant booking
Dynamic Pricing vs Static Pricing
Properties using daily dynamic pricing algorithms outperform static monthly rates by 18-30% in annual revenue. Dynamic pricing adjusts rates based on:
- Day of week (Friday-Saturday command 20-40% premiums)
- Local events and holidays
- Competitor pricing in real-time
- Length of stay (offer discounts for 7+ night bookings)
- Seasonality (peak vs shoulder vs low)
- Last-minute availability (drop rates for unsold dates within 7 days)
Manual pricing updates once monthly leave money on the table every single day.
Response Time Kills or Creates Bookings
Airbnb prioritizes hosts who respond to inquiries within 1 hour. Properties with 95%+ response rate within 1 hour rank significantly higher in search results. This means:
- Enable mobile notifications
- Use saved message templates for common questions
- Consider co-host if you can’t maintain response times
We track this religiously. Response time over 4 hours correlates with 25-35% lower conversion rates on inquiries.
Review Score Compounds Over Time
The gap between 4.8 and 4.95 star ratings appears small but represents dramatic booking differences. Properties above 4.9 stars with 20+ reviews receive 40-60% more booking inquiries than 4.7 rated properties.
Each negative review requires 5-7 perfect reviews to offset statistically. This is why obsessive attention to guest experience, proactive communication, and immediate problem resolution matter so much.
The Small Details That Matter
Properties achieving 75%+ occupancy consistently do these things that struggling properties skip:
- Welcome basket on arrival (costs $8, generates glowing reviews)
- Printed villa guide with WiFi passwords, restaurant recommendations, emergency contacts
- Blackout dates set 18-24 months in advance (allows guests to plan and book early)
- Same-day check-in available (captures spontaneous bookers)
- Airport transfer arranged (35% of guests want this, increases booking conversion)
- Local SIM cards offered (simple upsell, generates goodwill)
None of these cost more than $50/month but collectively drive measurable occupancy improvements.
The Harsh Truth About Airbnb ROI in 2026
Bali’s Airbnb market has matured from gold rush to real business. The 12-18% ROI claims you see in investment pitches assume:
- 80%+ occupancy (only 10% of properties achieve this)
- 30-40% expense ratios (real ratio is 50-60%)
- Zero vacancy periods (impossible)
- No major repairs (fantasy)
- Peak season rates year-round (absurd)
Realistic ROI expectations for 2026:
- Top 10% of properties: 6-9% cash-on-cash return
- Median properties: 2-4% cash-on-cash return
- Bottom 25% of properties: 0-2% or negative returns
This isn’t a criticism of Bali real estate investment. It’s reality. The returns are real, but they require professional management, continuous optimization, and treating this as an active business, not passive income.
Making Airbnb Bali Actually Profitable
Despite the sobering numbers, profitable Airbnb operation is absolutely achievable. You just need realistic expectations and smart execution.
Focus on Cash-on-Cash Return, Not Gross Yield
Stop calculating ROI on gross revenue. Your actual return is net profit divided by invested capital. A $300,000 villa generating $12,000 annual net profit delivers 4% cash return. Add potential property appreciation of 3-5% annually, and total return reaches 7-9%. Not spectacular, but solid.
Build vs Buy for Better Returns
Building custom villas costs 30-40% less than buying equivalent finished properties. A $280,000 construction project creates a villa worth $400,000+, giving you instant equity that dramatically improves effective returns.
Portfolio Approach Beats Single Villa
Two $250,000 villas generating $9,000 net profit each ($18,000 total) on $500,000 invested delivers 3.6% return while diversifying location risk. When Canggu has a slow month, Uluwatu might be booming.
Optimize for Specific Niches
Generic “modern minimalist” villas compete with 10,000 similar listings. Properties designed for specific niches (surf-themed for Uluwatu wave riders, yoga-retreat-ready for Ubud, family-friendly for Seminyak) command 20-30% premium pricing with less competition.
Accept That This Isn’t Passive Income
Even with full-service management, successful owners review monthly performance reports, approve major maintenance decisions, and stay informed about market conditions. Budget 3-5 hours monthly minimum for property oversight. Truly passive investments exist, but vacation rental Bali isn’t one of them.

The Real Bottom Line
Airbnb Bali generates real income, but the numbers are far more modest than investment pitches suggest. The average villa earns $20,774 annually at 65% occupancy with operating expenses consuming 50-60% of revenue. Net profit typically lands between $8,000-$15,000 for properties in the $250,000-$400,000 range.
Is it worth it? For investors approaching this as a 10-year business investment who want a lifestyle property they can use personally while generating income to offset costs, absolutely. For investors chasing 15% passive returns marketed in Facebook ads, you’ll be disappointed.
The winners in Bali’s mature Airbnb market are properties with:
- Professional management accepting 18-20% fees
- Unique positioning beyond generic modern design
- Locations in proven tourism zones with year-round demand
- Realistic 10-year holding periods factoring depreciation
- Proper PT PMA tax structure saving $4,000-$10,000 annually
- Financial reserves for 6-12 months operating expenses
🎯 Ready for Real Numbers, Not Fantasy Figures?
We manage 40+ villas across Bali’s prime locations, generating real returns for owners who understand this is a business, not a lottery ticket. Whether you’re buying an existing villa in Canggu, building in Pererenan, or evaluating Uluwatu villas, we provide transparent financial projections based on actual market data, not marketing hype.
We handle everything: property acquisition, construction management, professional photography, listing optimization, dynamic pricing, guest management, maintenance coordination, and monthly financial reporting. You get real-time visibility into performance and actual profit in your account monthly.
The Airbnb Bali opportunity is real. The returns just aren’t the 15-20% fairy tales you’ve been sold. With proper structure, professional management, and realistic expectations, 4-7% cash returns plus appreciation potential makes this a legitimate investment. Just know what you’re getting into before you wire the money.
Villa rental Bali through Airbnb works, but success requires understanding the real profit breakdown, accepting 50-60% operating expense ratios, and committing to professional operation. Do that, and you’ll join the 10% of properties achieving 75%+ occupancy and generating meaningful income.